As a core of modern manufacturing, NC technology directly impacts product quality and efficiency.
The rise of aerospace and high-end manufacturing demands higher machining accuracy and surface quality.
Traditional machining struggles to meet high-precision, high-efficiency, and complex surface demands.
Therefore, it is of great significance to conduct an in-depth study on the application of CNC technology in precision machining.
This involves optimizing parameters and processes to boost manufacturing performance.
This study examines CNC optimization for precision machining using experiments and data analysis.
CNC precision machining technology status quo
CNC precision machining technology has advanced significantly worldwide with manufacturing growth.
Developed countries lead in five-axis and ultra-precision machining technology R&D.
The precision of their CNC systems can reach the nanometer level.
Industries widely use these systems in aerospace and optical manufacturing.
Experimental program design
Experimental equipment and materials
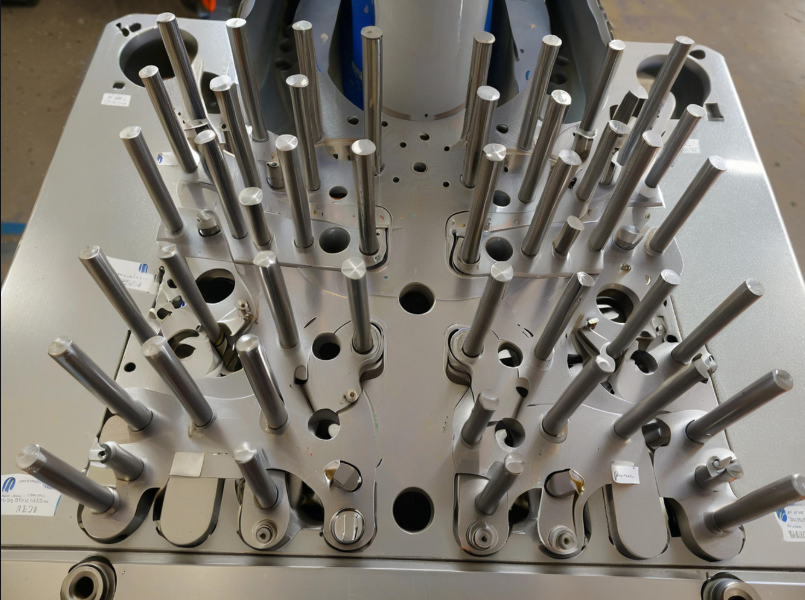
Experiments used the DMG MORI DMU50 five-axis center with 24,000 rpm spindle speed and ±0.003mm accuracy.
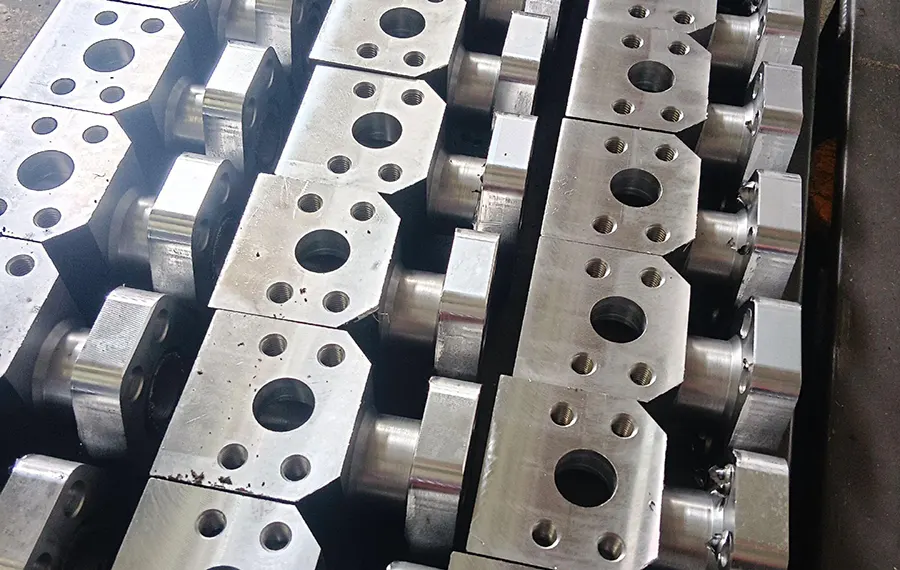
Manufacturers make the workpiece from aircraft-grade 7075 aluminum alloy with dimensions 100×80×60mm and hardness HB150.
Operators use a φ12mm Mitsubishi carbide end mill with a 36mm overhang for machining rigidity.
Selection of process parameters
The researchers designed a three-factor five-level orthogonal experiment based on the pre-experimental data.
Researchers set the cutting speed range at 100–300 m/min with 50 m/min intervals; the feed rate was set at 0.05–300 m/min.
Researchers set the feed rate from 0.05 to 0.25 mm/z at 5 levels and took the depth of cut from 0.2 mm to 1.0 mm at 0.2 mm intervals.
The Design of Experiments Assistant created an L25 orthogonal table for 25 parameter combination tests.
The machining path adopts the contouring strategy, and the radial depth of cut is kept at 30% of the tool diameter.
Test methods and evaluation indexes
Researchers measured surface roughness Ra with the Alicona InfiniteFocus G5 3D profiler using the following formula.

Researchers characterize dimensional accuracy by the true roundness deviation E, calculated as follows.

Where Rmax – maximum radius,mm
Rmin – minimum radius,mm
The comprehensive evaluation index Q of machined surface quality adopts the following weighted calculation model.

Where Ra0, E0, T0 – surface roughness, true roundness and machining time, respectively, the benchmark value
w1, w2, w3 – weighting coefficients, and w1 + w2 + w3 = 1
The researchers calculated the tool wear rate VB by measuring the wear width of the back face.

Where A1 – tool area after wear,mm2
A0 – initial tool area,mm2
t – cutting time,min
Researchers input data into Minitab 19 for ANOVA to model and optimize process parameters.
Operators controlled the ambient temperature at 20±0.5°C and humidity at 45%±5% during the measurement process.
Optimization of process parameters
Cutting speed on machining accuracy impact
Experimental data (Table 1) show cutting speed (100-300 m/min) affects machining accuracy non-linearly.

At 180 m/min cutting speed, the workpiece achieves optimal dimensional accuracy with a true roundness deviation of 0.004 mm.
Table 1 Effect of cutting speed on machining accuracy (feed: 0.08mm/z, depth of cut: 0.6mm)
The experiment used a cutting speed of 180 m/min, keeping spindle temperature rise within 3.5 °C.
Operators reduced the tool wear rate to 0.015 mm/min. Additionally, the qualified rate of workpiece size increased to 98.5%.
Influence of feed on surface quality
The feed rate interval is 0.05–0.25 mm/z, positively correlating with surface roughness Ra.
Researchers obtained the best surface quality at a feed rate of 0.08 mm/z, with an Ra value of 0.4 μm.
SEM observation shows that at 0.08 mm/z feed, tool cutting traces are uniform with no tearing or adhesion.
After the feed increased to 0.15mm/z, the surface appeared periodic ripples, Ra value rose to 0.8μm.
Depth of cut optimization analysis
The depth of cut ranged from 0.2 to 1.0 mm, showing significant interaction with machining efficiency and surface quality.
Data analysis shows 0.6 mm depth of cut achieves optimal balance with 43.2 cm³/min removal efficiency and Ra below 0.5 μm.
The cutting force test shows a radial-to-axial force ratio of 1.8:1, with tool vibration amplitude kept within 2.5 μm.
Cooling method selection study
We compared three cooling methods: dry cutting, wet cooling, and MQL.
The experiment set the MQL oil-air mixture flow rate at 60 ml/h and the air pressure at 0.5 MPa.
MQL reduced workpiece surface roughness by 28% to Ra 0.35 μm compared to wet cooling.
MQL saves 95% of cutting fluid compared to wet cooling, significantly reducing cost and environmental impact.
Intelligent control strategy
Tool compensation technology
Based on the measurement data of Renishaw OMP60 optical tool setting instrument to establish a tool wear prediction model.
Experimentally measured tool in the cutting 180min, the tip arc radius increased from 0.8mm to 1.2mm, the tool back angle from 12 ° to 8.5 ° reduction.
By tracking the tool wear status in real time, the system automatically calculates the compensation amount and updates the tool position data.
The compensation strategy adopts a segmented compensation method. When the wear amount is less than 0.1 mm, one-time compensation is applied.
When the wear amount exceeds 0.1 mm, step-by-step compensation is used. In this case, the compensation amount for each step does not exceed 0.05 mm.
Experiments show the compensation strategy improved accuracy by 35%, extended tool life 1.8 times, and cut costs by 22%.
Real-time monitoring system design
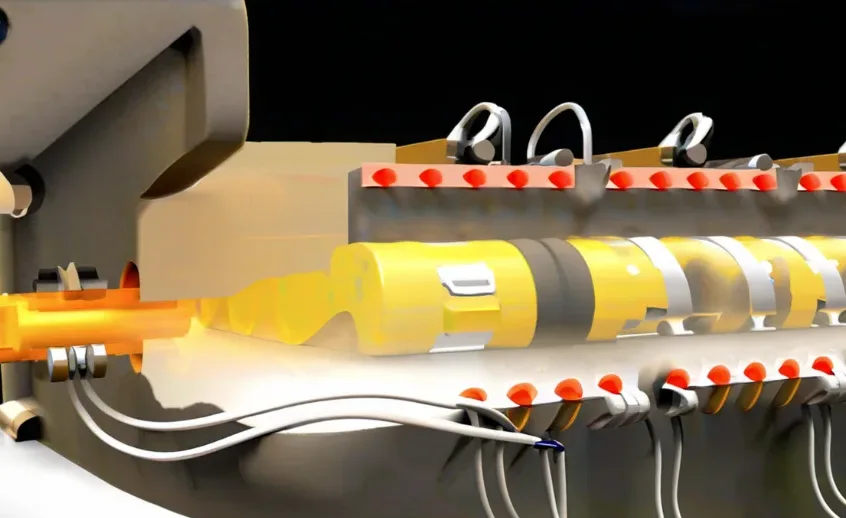
Developers used multi-sensor fusion and sensors to create a real-time monitoring system.
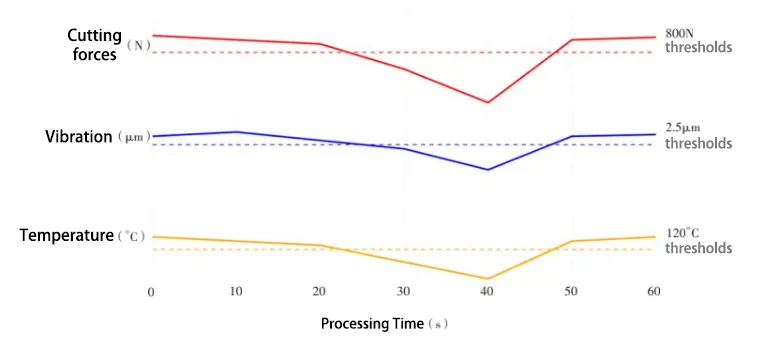
The system uses a PXI platform for data acquisition and processing, realizing the simultaneous monitoring of cutting force, vibration and temperature.
The experimental data show (see Fig. 1) that the surface roughness increases by 52% when the cutting force changes by more than 20% of the set value.
When the vibration amplitude exceeds 2.5 μm, the roundness error increases by 0.008 mm.
When the cutting zone temperature exceeds 120°C, the workpiece undergoes obvious thermal deformation.

Note: Sampling frequency: cutting force 20kHz, vibration 50kHz, temperature 50Hz, data filtered.
Adaptive control algorithm
A fuzzy neural network algorithm enables real-time machining parameter optimization. The cutting force control model is as follows.

Where:F(t) is the cutting force output value;e(t) is the cutting force error;
Kp, Ki, Kd are PID parameters.
Adaptive tuning rule.

Where η1, η2, η3 – learning rate
u(t)-control amount
The experimental results show that the cutting force fluctuation is reduced by 45% and machining accuracy is improved by 32% after using this algorithm.
Error compensation method
Laser interferometer measurements provided geometric error data to establish 21 compensation models.
Measured data show that the compensation system is based on measured data to establish a spatial error mapping grid, the grid spacing is set to 50mm.
At a feed rate of 6,000 mm/min, the system realized real-time compensation at the submicron level.
After compensation, cylindricity error dropped from 0.018mm to 0.006mm, contour error from 0.025mm to 0.008mm, improving accuracy by 65%.
Conclusion
A CNC optimization scheme for efficient precision machining was developed through experiments and data analysis.
The study shows that the optimal combination of cutting parameters can significantly improve machining accuracy and efficiency.
Intelligent control strategies enhance machining stability and support the process.
The experimental validation results show that the optimization scheme can significantly improve productivity.
At the same time, it ensures the required machining accuracy. Therefore, the scheme holds good value for engineering applications.
Future research will explore AI applications in CNC machining for smarter manufacturing.


